Training a deep learning model is a complicated task which not only needs to adjust the parameters such as learning, but also needs to process the training data. Normalized the data is one usefule approach and has been widely used for preparing dataset.
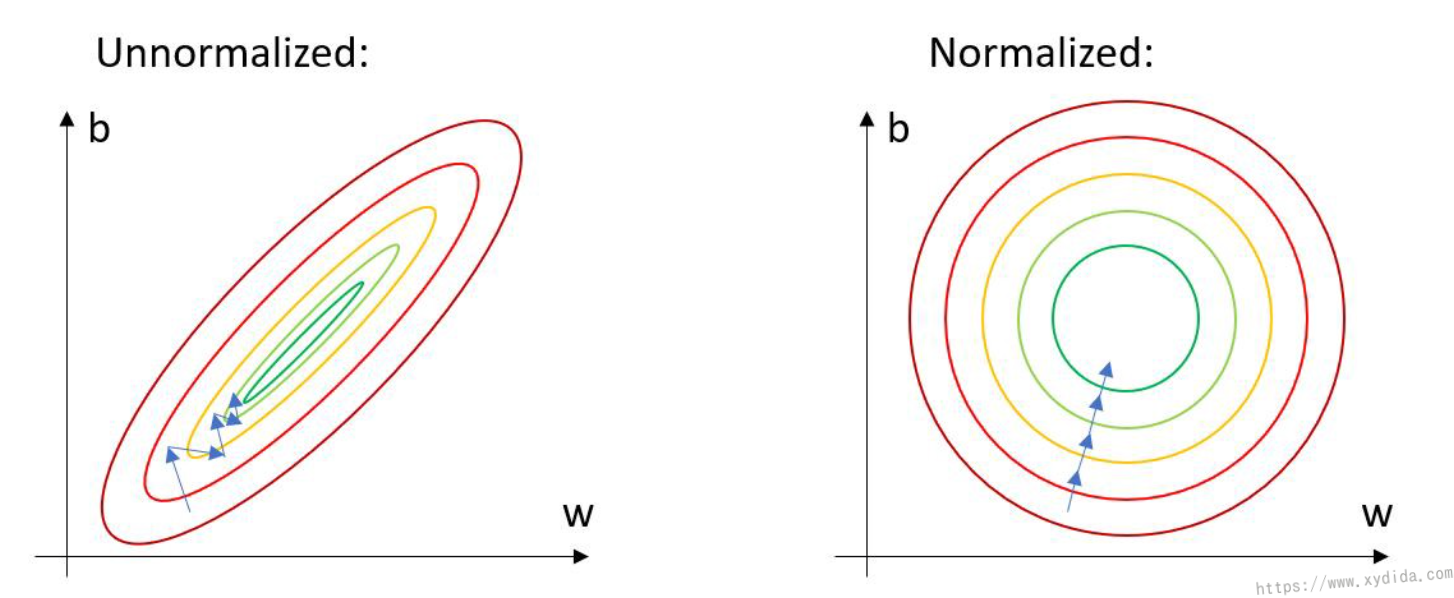
In deep learning, the image data is normalized by the mean and stadard deviation. This helps get consistent results when applying a model to new images. Hence, the convergence of the model can be improved [1]. In the ImageNet which is a open-source dataset, its mean and STD values have been sampled and can be used directly:
1 | mean = (0.485,0.456,0.406) |
If you apply these mean and std into your own dataset, you may not get a good performance because these stats belong to the ImageNet which has a different distribution of the custom dataset. Thus in your custom dataset, you need to mannully calculate the stats in advance of training. After sampling the stats, the new data can be obtained by the following formulation:
1 | # mean:mean value of each channel |
In Pytorch, the dataset us usually wrapped with DataLoader [2], and DataLoader has a transform parameter which can perform some transformations on images, such as rotation, random crop. Normalize transform is also supported to normalize images with the given mean and std. Here is a example:
1 | train_transform = torchvision.transforms.Compose([ |
But how to calculate the mean and std in the DataLoader? Here I give two ways:
- Calculate mean and std of the three channels in each batch and average them at the end.
1 | def mean_std_for_loader1(loader: DataLoader): |
- The std can be derivated from the mean of square of the data and square of the mean of the data, this is referenced from Jorrit Willaert [1]. Here is the formula:

1 | def mean_std_for_loader(loader: DataLoader): |
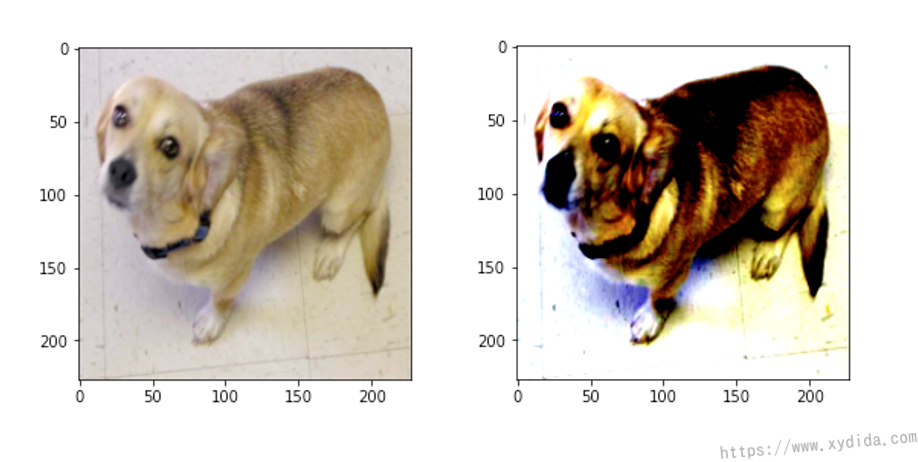
This method is a little bit tricky and hard to be understanded easily. After normalization, the image looks more sharper:
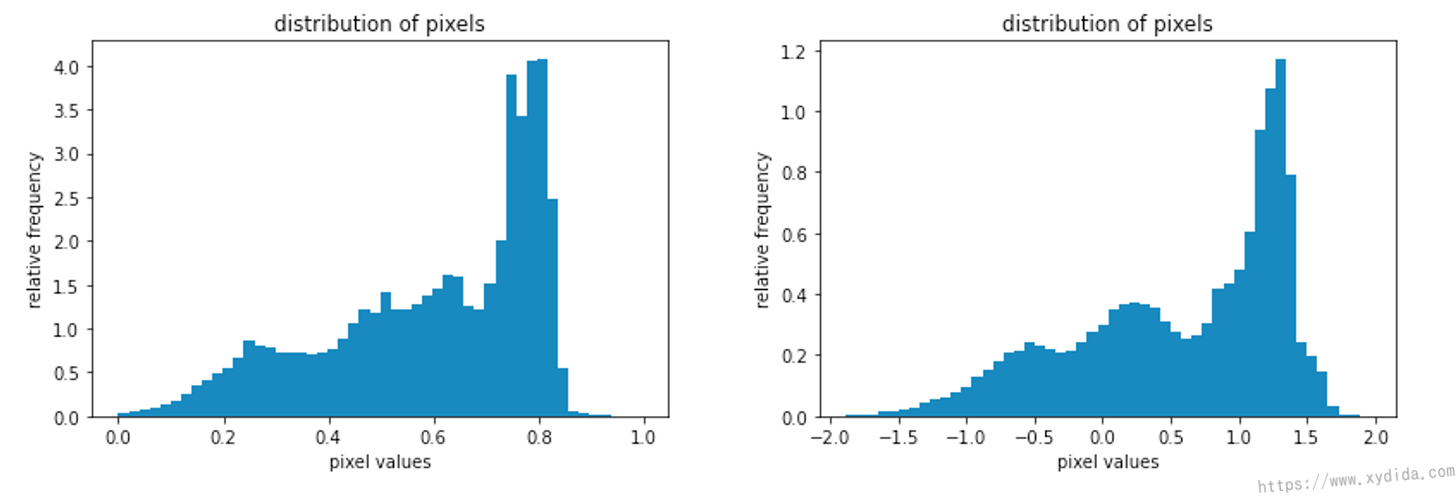
We can also investigate the image base on its histogram of pixels, the unnormalized image (left) has a pixel distribution between 0 and 1 (because of the transformation of ToTensor()), after the normalization, its pixels are roughly in the range [-2;2].
In this experiment, I’m confused that the two outputs are slighly different. Was is caused by the accuracy loss during the operation of the float number?
Let’s compare the training results. I built a AlexNet model to classify dog and cat. The dataset is downloaded from Kaggle [3]. For comparison, the model is trained twice separately.
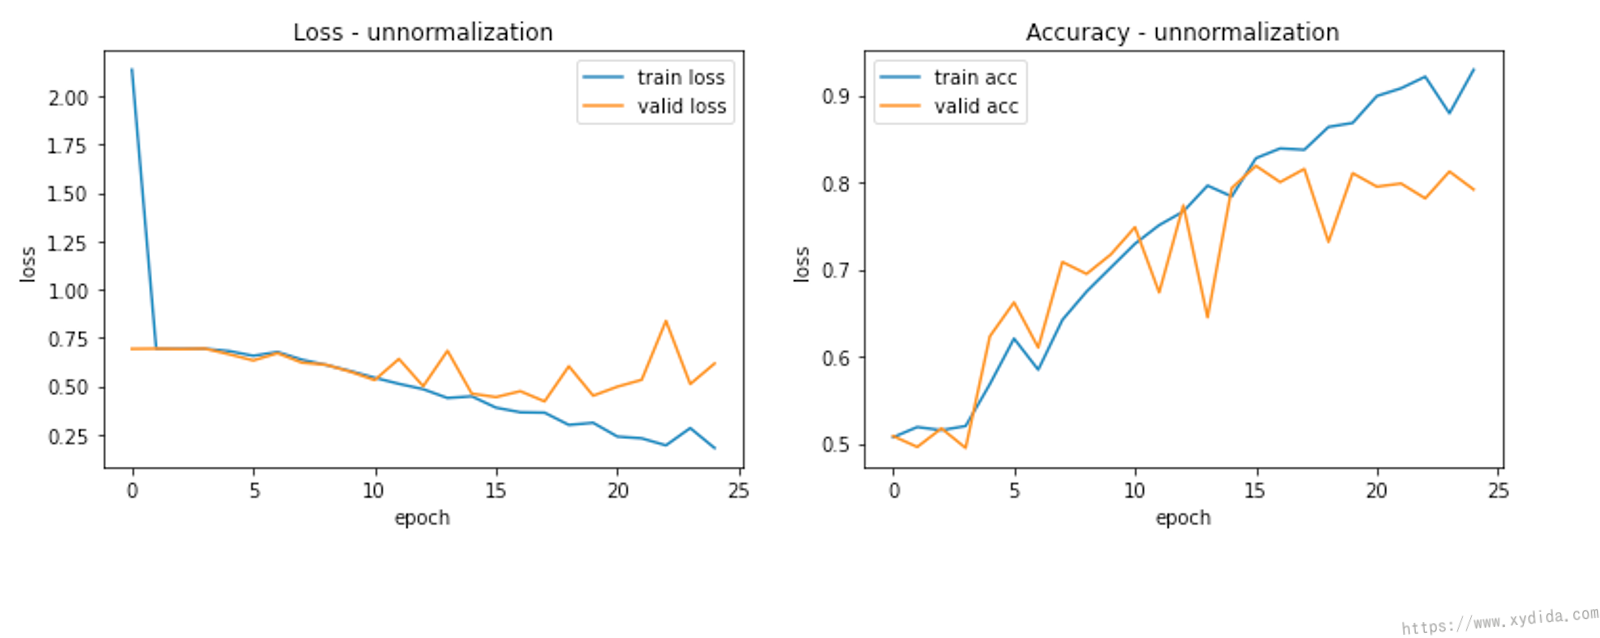
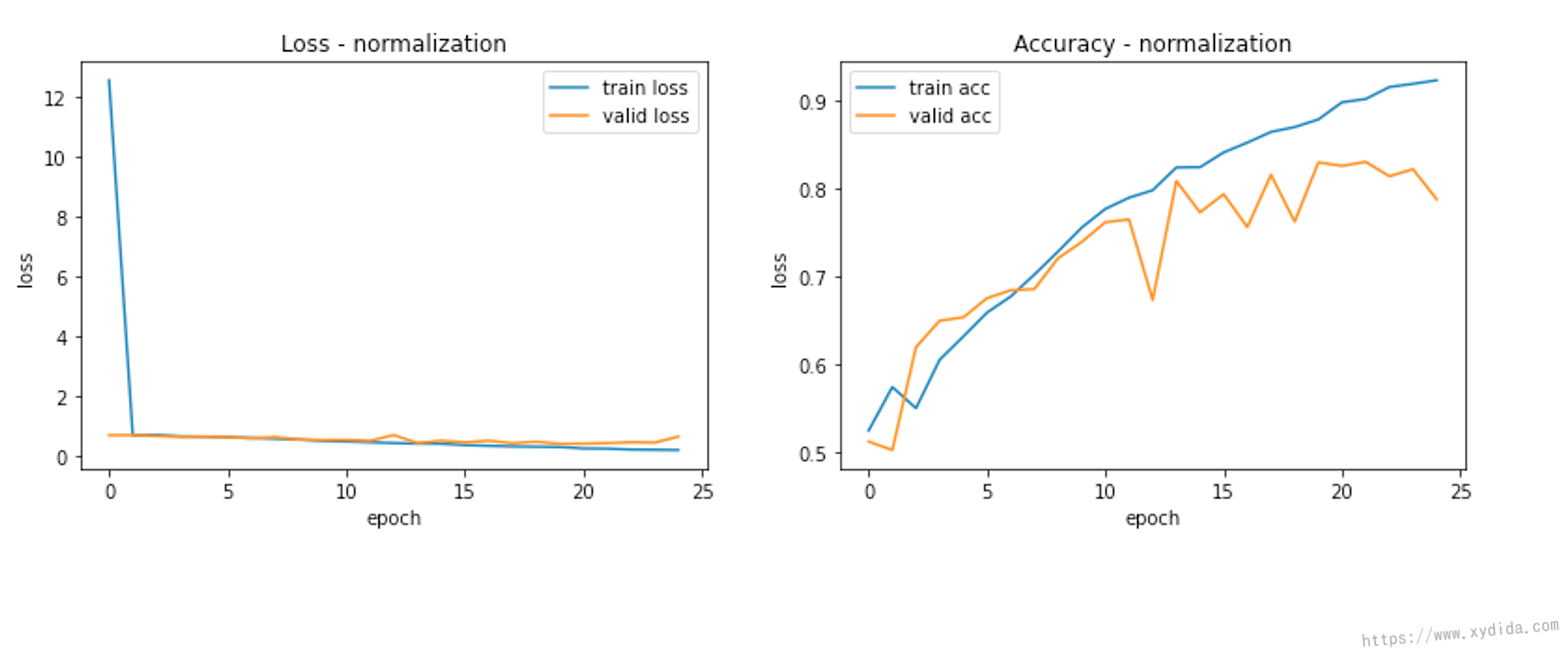
This first plot demonstrates the training and validation loss, and training and validation accuracy without normalization during 25 epochs. The second plot illustrates the results with the normalized data. With the help of normalization, since the performance is quite same, but all of the results are more smooth than unnormalized data. The model looks much more stable.
Reference:
[1] https://towardsdatascience.com/how-to-calculate-the-mean-and-standard-deviation-normalizing-datasets-in-pytorch-704bd7d05f4c
[2] https://pytorch.org/tutorials/beginner/basics/data_tutorial.html
[3] https://www.kaggle.com/datasets/tongpython/cat-and-dog