Image thresholding with Otsu method

Table of content
  1. 1. Algorithm
  2. 2. Code

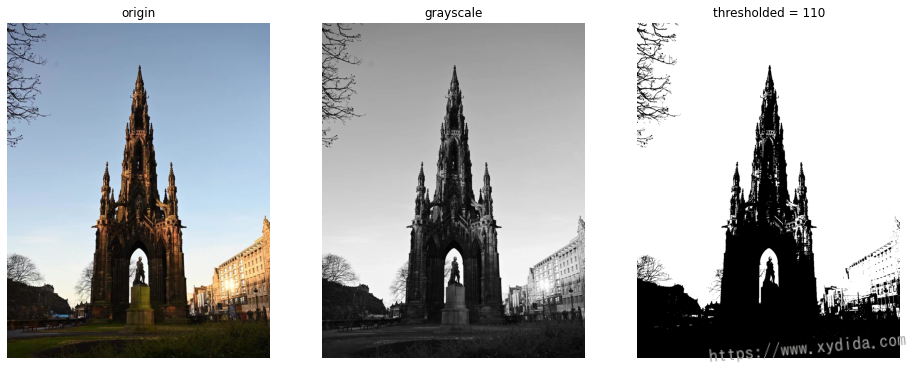
Image thresholding is a process for separating the foreground and background of the image. There are lots of methods for image thresholding, Otsu method is one of the methods proposed by Nobuyuki Otsu. The Otsu algorithm is a variance-based way to automatically find a threshold value by which the weighted variance between foreground and background is the least.

With different threshold value, the pixel values of foreground and background are various. Hence, both pixels have different variance for different thresholding. The key of Otsu algorithm is to calculate the total variance from the two variances of both distributions. The process needs to iterate through all the possible threshold vlaues and find a threshold that makes the total variance is smallest.

Algorithm

The Otsu method iteratively search for the threshold value that minimizes the weighted sum of variance of the two classes (foreground and background). The pixel value is usually betwwen 0-255, So if the threshold value is 100, then all the pixels with values that less than 100 will be the background and all the pixels with values that greater than or equal to 100 will be the foreground of the image. The formula for find the variance at any threshold of t is given by:

θ2(t)=ωbg(t)θbg2(t)+ωfg(t)θfg2(t)(1)\theta^2(t) = \omega_{bg}(t)\theta^2_{bg}(t) + \omega_{fg}(t)\theta^2_{fg}(t) \tag{1}

where ωbg\omega_{bg} and ωfg\omega_{fg} are the probability of the number of pixels for each class at threshold t and θ2\theta^2 represents the variance of color values.

So, what is the probability in eq. 1? Here is a detail explain, let’s assume:

PallP_{all} be the total count of pixels in an image,
Pbg(t)P_{bg}(t) be the count of background pixels at threshold t,
Pfg(t)P_{fg}(t) be the count of foreground pixels at threshold t

So, the weights are given by:

ωbg(t)=Pbg(t)Pallωfg(t)=Pfg(t)Pall(2)\omega_{bg}(t) = \frac{P_{bg}(t)}{P_{all}} \\ \omega_{fg}(t) = \frac{P_{fg}(t)}{P_{all}} \tag{2}

The variance can be calculated using the below formula:

θ2(t)=(xixˉ)2N(3)\theta^2(t) = \frac{\sum(x_{i}-\bar{x})^2}{N} \tag{3}

where,

xix_{i} is the value of pixel at i in the group (bg or fg)
xˉ\bar{x} is the mean of pixel values in the group (bg or fg)
NN is the number of pixels.

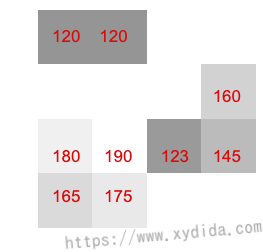
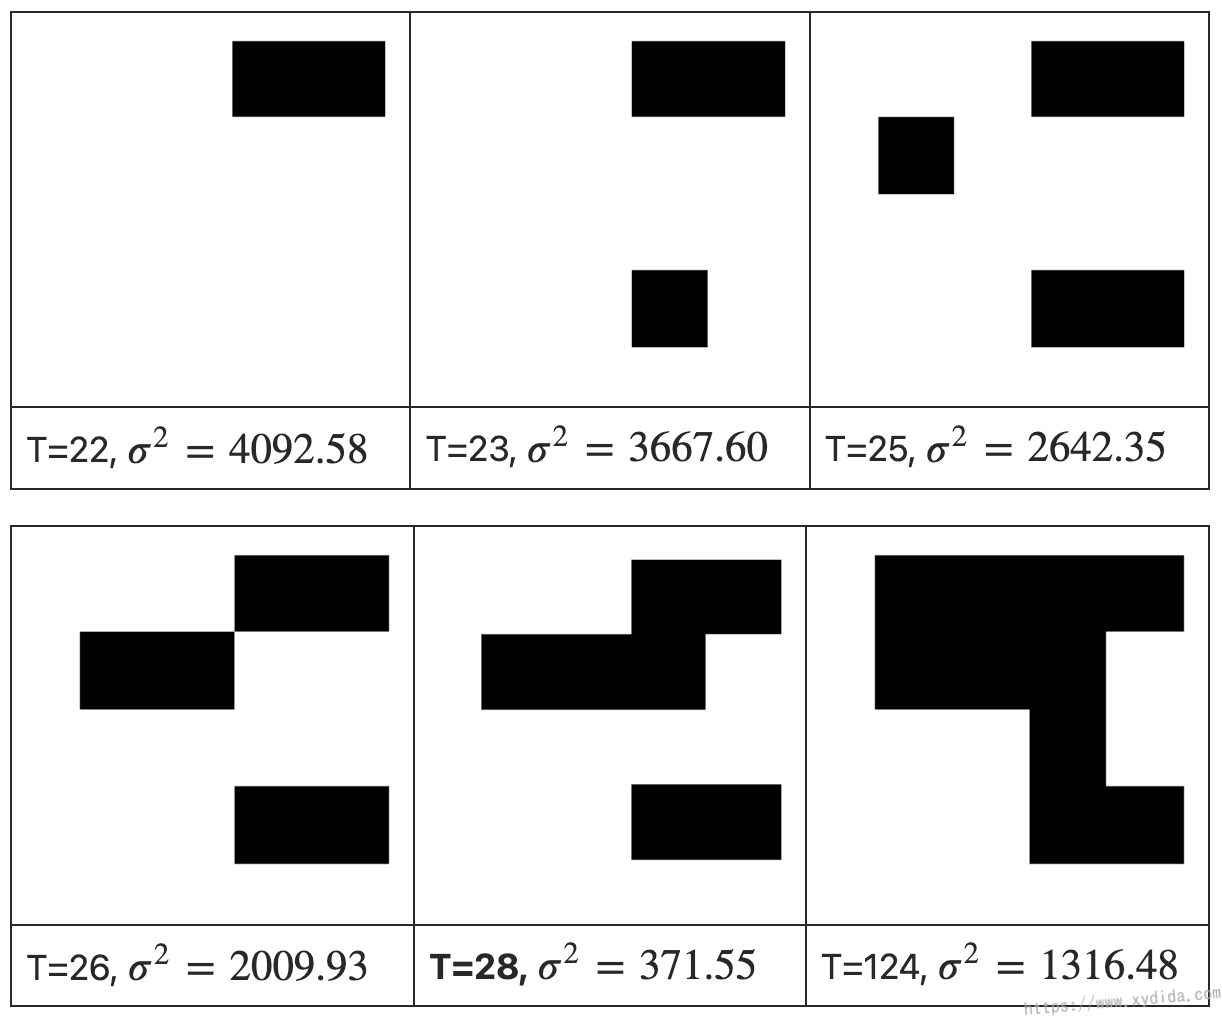
Now, I’ll give an example to understand the algorithm. here is an image with 4x4 size, the Threshold T is 100:

4x4 image

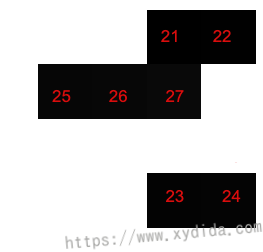
The foreground is the pixel value which greater than or equal to 100, the background is the pixel value less than 100:

foreground image background image

Now the pixel values have been separated to two parts. Thus I can get:

Pall=44=16P_{all} = 4*4 = 16
Pbg=7P_{bg} = 7
Pfg=9P_{fg} = 9

The weights can be:

ωbg(t=100)=PbgPall=716=0.44\omega_{bg}(t=100) = \frac{P_{bg}}{P_{all}} = \frac{7}{16} = 0.44
ωfg(t=100)=PfgPall=916=0.56\omega_{fg}(t=100) = \frac{P_{fg}}{P_{all}} = \frac{9}{16} = 0.56

The means of foreground and background:

xˉbg=21+22+25+26+27+23+247=24\bar{x}_{bg} = \frac{21+22+25+26+27+23+24}{7} = 24
xˉfg=120+120+160+180+190+123+145+165+1759=153.1\bar{x}_{fg} = \frac{120+120+160+180+190+123+145+165+175}{9} = 153.1

The variances:

θbg2(t=100)=(2124)2+(2224)2+...+(2424)27=4\theta^2_{bg}(t=100) = \frac{(21-24)^2 + (22-24)^2 + ... + (24-24)^2}{7} = 4
θfg2(t=100)=(120153.1)2+(120153.1)2+...+(175153.1)29=657.43\theta^2_{fg}(t=100) = \frac{(120-153.1)^2 + (120-153.1)^2 + ... + (175-153.1)^2}{9} = 657.43

Take all the values into the Eq. (1):

θ2(t=100)=0.444+0.56657.43=369.9208 \theta^2(t=100) = 0.44*4 + 0.56*657.43 = 369.9208

Also, we can find other values on different threshould t.

Variances with different thresholds 2

From the above experiments, the least variance can be achieved at a threshold of 28.

Code

1
2
3
4
5
6
7
8
9
10
11
12
13
14
15
16
17
18
19
20
21
22
23
24
25
26
27
28
29
30
31
32
33
34
35
36
37
38
39
40
41
42
43
44
45
46
47
48
49
50
51
52
53
54
55
56
57
58
59
60
61
62
63
64
65
66
from PIL import Image
import matplotlib.pyplot as plt
import numpy as np

def threshold_otsu(gray_img, nbins=.1):
all_pixels = gray_img.flatten()
p_all = len(all_pixels)
least_variance = -1
least_variance_threshold = -1

# create an array of all possible threshold values which we want to loop through
color_thresholds = np.arange(np.min(gray_img)+nbins, np.max(gray_img)-nbins, nbins)

# loop through the thresholds to find the one with the least class variance
for color_threshold in color_thresholds:
# background
bg_pixels = all_pixels[all_pixels < color_threshold]
p_bg = len(bg_pixels)
w_bg = p_bg / p_all
variance_bg = np.var(bg_pixels)

# foreground
fg_pixels = all_pixels[all_pixels >= color_threshold]
p_fg = len(fg_pixels)
w_fg = p_fg / p_all
variance_fg = np.var(fg_pixels)

variance = w_bg * variance_bg + w_fg * variance_fg
print("trace:", variance, color_threshold)

if least_variance == -1 or variance < least_variance:
least_variance = variance
least_variance_threshold = color_threshold

print('done!')
return least_variance_threshold

img = Image.open('IMG_5474.jpg')
gray_img = img.convert('L')
np_gray_img = np.array(gray_img)

o_threshold = threshold_otsu(np_gray_img)
print('least threshold: ', o_threshold)

# output
# least threshold: 110.1

plt.figure(figsize=(16,16))
plt.subplot(1,3,1)
plt.axis('off')
plt.imshow(img)
plt.title('origin')

plt.subplot(1,3,2)
plt.imshow(gray_img, cmap='gray')
plt.axis('off')
plt.title('grayscale')

np_gray_img = np.array(gray_img)
binary_np_gray_img = 1.0 * (np_gray_img > 110)
plt.subplot(1,3,3)
plt.imshow(binary_np_gray_img, cmap='gray')
plt.axis('off')
plt.title('thresholded')

plt.show()

Output:

Reference:

[1] https://en.wikipedia.org/wiki/Otsu's_method

[2] https://muthu.co/otsus-method-for-image-thresholding-explained-and-implemented/